
Putting Corrections in Perspective: The (Usually) Sunny Fourth Quarter
October 30, 2015

With the S&P 500 crossing into “correction” territory (down at least 10% from its high) in the closing days of September for the third time since August this year, investors are understandably anxious. After all, the U.S. stock benchmark has been in a secular bull market since March 2009, making it longer than the previous bull market, which ran a little more than five years, from late October 2002 to October 2007. The downswing made prophets of a host of market watchers, some of whom had been calling for a correction since last spring. And then there was that nasty, historic intra-day decline in the Dow Jones Industrial Average of 1,000 points on August 24, after which it rallied to close down nearly 600 points, which was certainly unsettling to many investors.
Now that the correction is fully upon us, though, what should you make of it? Is it time to bail out of stocks and park your money in bonds or cash? For long-term investors, the answer is a resounding no, for the basic reason that, for all of its gyrations, stocks offer the best source of growth and protection against inflation—especially when they’re on sale.
Still, that might be cold comfort when memories of the great bear market of 2007-2009 are fresh in so many minds. So, here we’d like to offer some additional facts, some historical information to help you keep the current correction in perspective and possibly maintain a cooler head:
Year-End Market Trends
The fourth quarter is usually quite good for stocks. From 1990 through 2014—a span of 25 years, the S&P 500 has gained more on a total return basis in the last three months of the year (October through December) than it gained in the prior nine months. To put a fine point on it, the index generated 253.1% on a total return basis (gains plus dividends) in the combined fourth quarters, compared to a gain of 181.3% for the first nine months of those 25 years.
Individually, the last two months of the year are among the market’s strongest. On average, over the past 50 years, December ranks as the strongest for stocks, and November is second-best (and third-best over the last 25 years), as you can see in the table below.
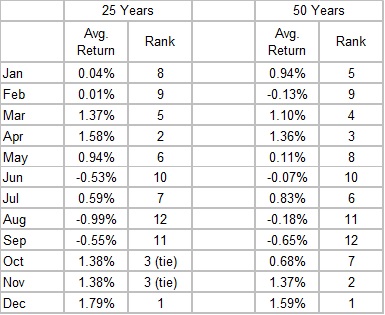
Another fact jumps out from this table: August and September – the months when the latest correction emerged – are the worst for stocks. That often comes as a surprise to individual investors, as the most notorious one-day crashes in market history over the last 90 years – 1929’s “Black Tuesday” and the “Black Monday” of 1989 – occurred in October. Those dates belie the facts, however, that October is one of the better months for stocks and that the last two months of summer are the, rock-bottom, the worst-performing.
The phenomenon the table records is what’s referred to as the stock market’s “seasonality.” No one knows for sure why this pattern holds up. Some market professionals blame September’s typical swoon on impatient investors who give up on underperforming stocks by the end of the third quarter, including individual investors and mutual funds, and that investors are in a grumpy mood as summer ends. Conversely, it’s said that investors are more optimistic around the year-end holidays. This may all sound like guesswork, but the point is that the trends are fairly reliable.
But take note: we just said “fairly reliable,” not “completely reliable.” As Mark Twain is reputed to have said, history doesn’t repeat itself exactly. Every trend has its exceptions, and it’s not hard to find in the historical record weak fourth quarters and strong Augusts and Septembers.
Nobody really knows what lies ahead for stocks. But keeping these facts in mind can help you to avoid rash decisions you could regret. Better to have an investment strategy that takes into account your long-term goals and your tolerance for risk, and keep your investment portfolio well-diversified at all times.